2021-04-03 11:03:45
 最高値更新のETH、次はどうなる? 仮想通貨チャート分析:ビットコイン・イーサ・XRP(リップル)・ライトコイン
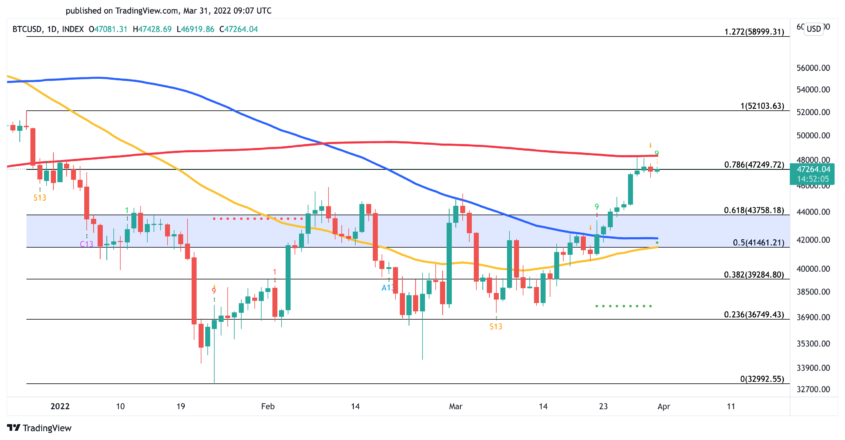
ビットコインは3月31日と4月1日に同事線のローソク足パターンを形成した。これは強気派と弱気派の間でバランスが拮抗していることを示唆している。しかし、ポジティブな兆候は、強気派はまだ諦めていないことだ。強気派は再び価格を60,000ドルのレジスタンスを超えて押し上げようとしている。
60,000ドルから61,825.84ドルの直上のレジスタンスゾーンを超える強力な上昇は、強気派が主導権を取り返したことを示唆する。これは、69,279ドル、次に79,566ドルの目標とする次の上昇トレンドのの開始につながるだろう。
免責条項: Fusion Media would like to remind you that the data contained in this website is not necessarily real-time nor accurate. All CFDs (stocks, indexes, futures) and Forex prices are not provided by exchanges but rather by market makers, and so prices may not be accurate and may differ from the actual market price, meaning prices are indicative and not appropriate for trading purposes. Therefore Fusion Media doesn`t bear any responsibility for any trading losses you might incur as a result of using this data.
Fusion Media or anyone involved with Fusion Media will not accept any liability for loss or damage as a result of reliance on the information including data, quotes, charts and buy/sell signals contained within this website. Please be fully informed regarding the risks and costs associated with trading the financial markets, it is one of the riskiest investment forms possible.


